Event & Session Properties Just Got a Major Upgrade

We've always believed that collecting data should be simple. But collecting it is only half the story. What you do with it is where the real value is.
Up until now, digging into your event and session properties was underwhelming. You could see that something happened, but understanding the context around it was a challenge. It was a barrier to getting insights from your data, so we rebuilt the property screens from scratch to fix that.
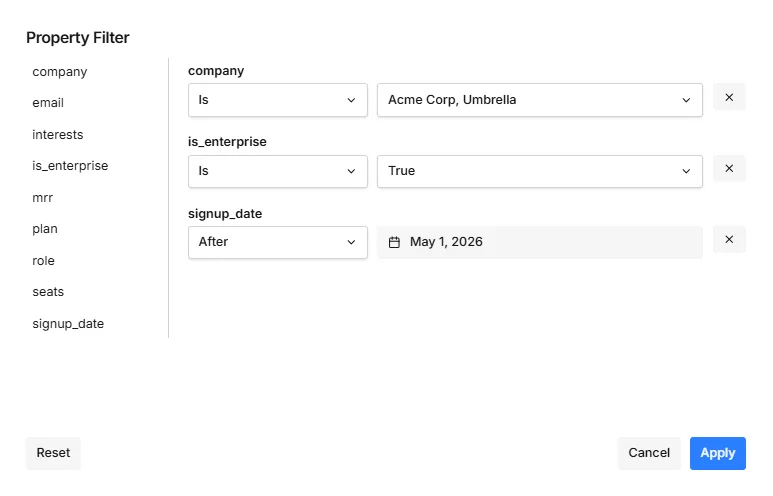
Filter on event and session data
The biggest thing in this update is simple: you can now filter directly on your event and session properties. Each filter is data-type aware and has operators specific to that property.
New metrics, tables, and visualizations
We didn't just add filtering. We rebuilt how property data is displayed from the ground up.
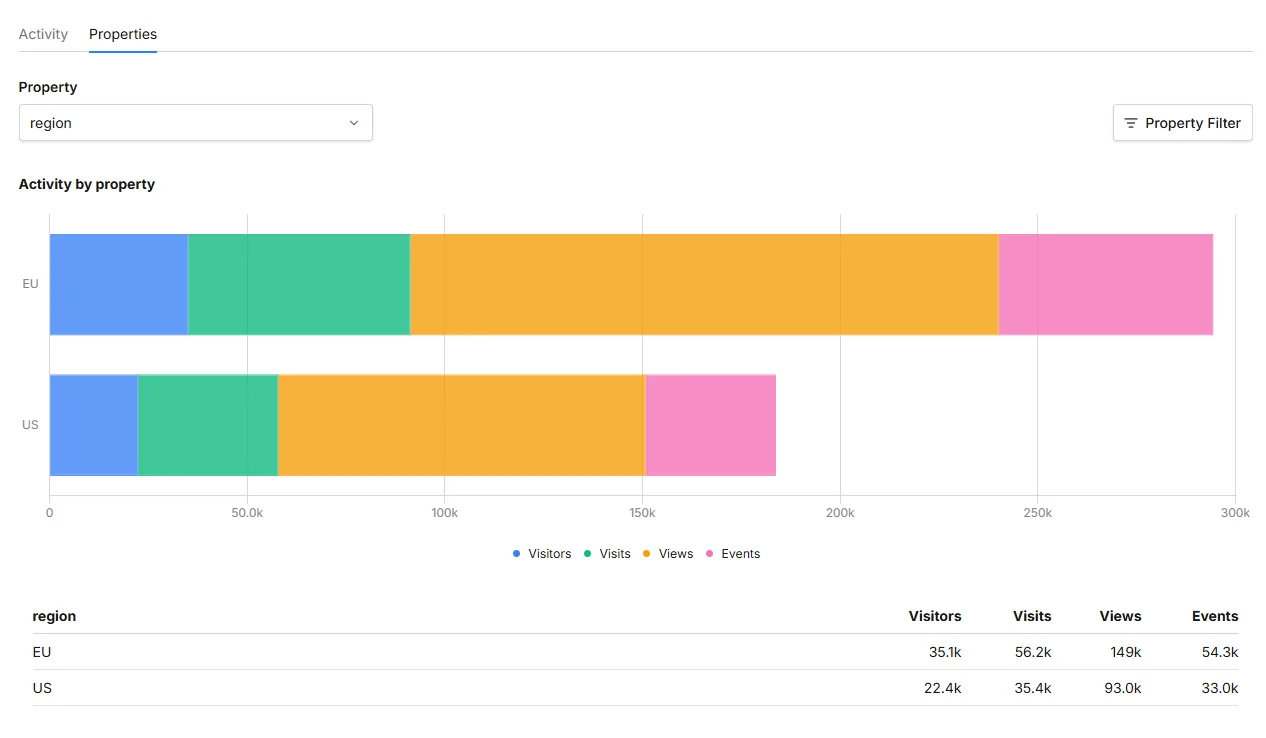
There are new graphs and tables designed specifically for event and session properties. You also get aggregates out of the box, so you can see totals, breakdowns, and distributions without having to do the math yourself.
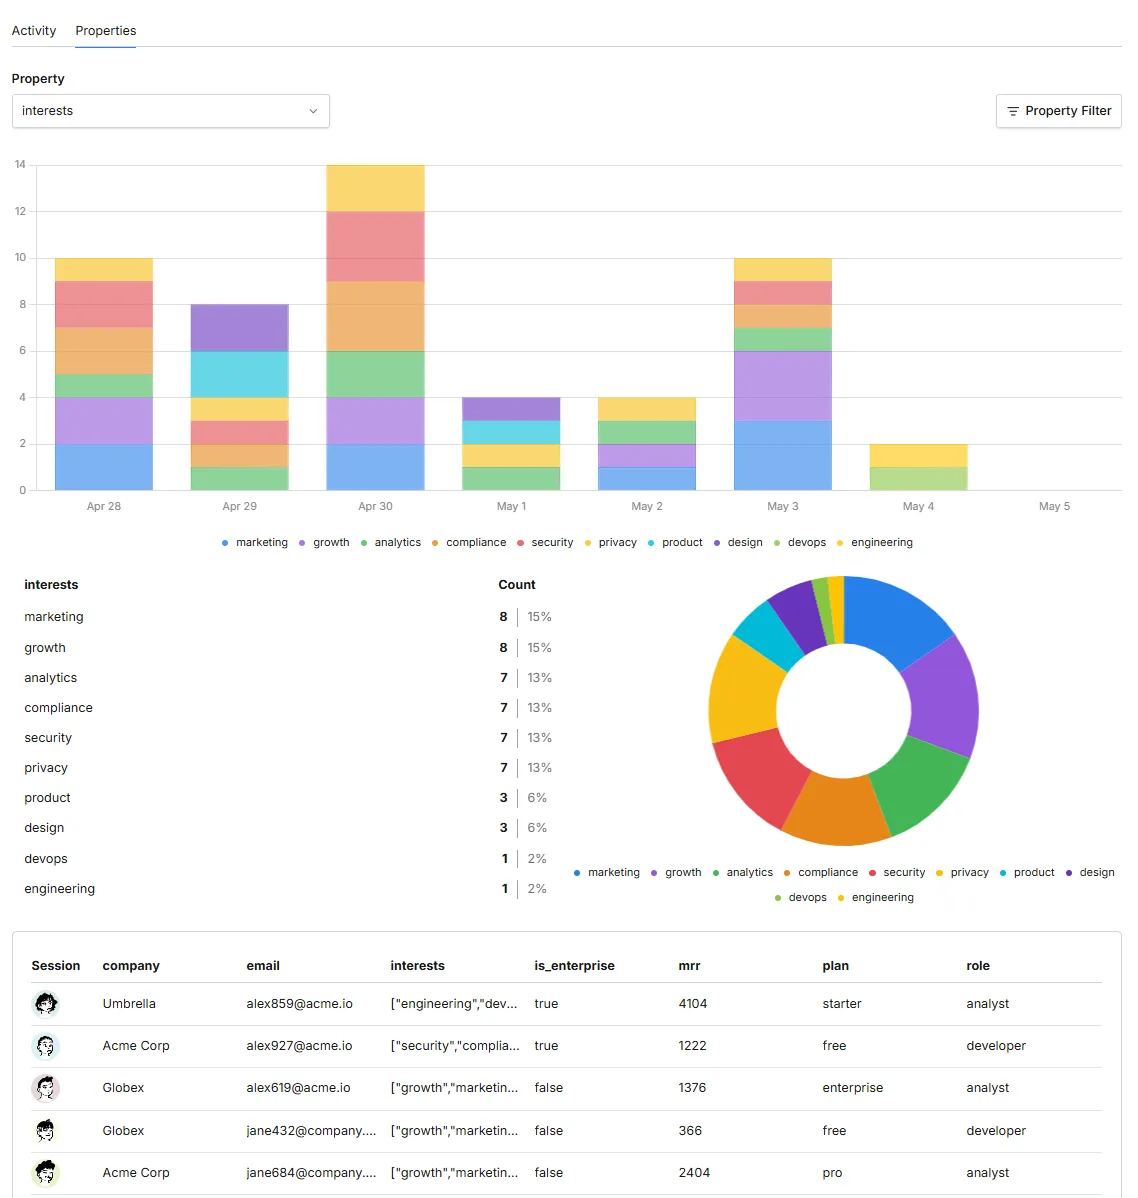
The part we're most happy with: the screens are data-type aware. Each data-type displays its own unique set of metrics, tables, and visualizations. This makes it much easier to understand your data at a glance and get to insights faster.
Why we built it this way
Event and session properties have always been powerful in Umami, but they felt like a second-class citizen when it came to actually exploring them. We wanted property data to feel as natural and useful as the rest of your analytics: something you reach for instinctively, not something you have to wrestle with.
These new screens are a big step in that direction.
Try it out
The new Event and Session property screens are available now. Head to your dashboard, open any event or session, and start exploring.
As always, we'd love to hear what you think. Find us on GitHub or Discord.