Understanding Heatmaps

Standard analytics tell you a lot about what's happening on your site, but they don't tell you much about where. You can see that visitors are dropping off on a certain page, but that alone doesn't tell you much. Are they not finding what they're looking for? Is something at the top of the page pulling attention away from your sign-up button? Are people scrolling past your most important content without ever seeing it? Heatmaps give you a visual layer on top of your data that makes those questions a lot easier to answer.
Umami now includes heatmaps as part of the Business plan. There are two types: click heatmaps and scroll heatmaps. Together they give you a clear, page-level picture of where visitors are actually focusing their attention.
Click Heatmaps
Click heatmaps overlay your actual page with a visualization of where visitors are clicking. Areas with more clicks show up warmer. Areas that aren't getting attention stay cool.
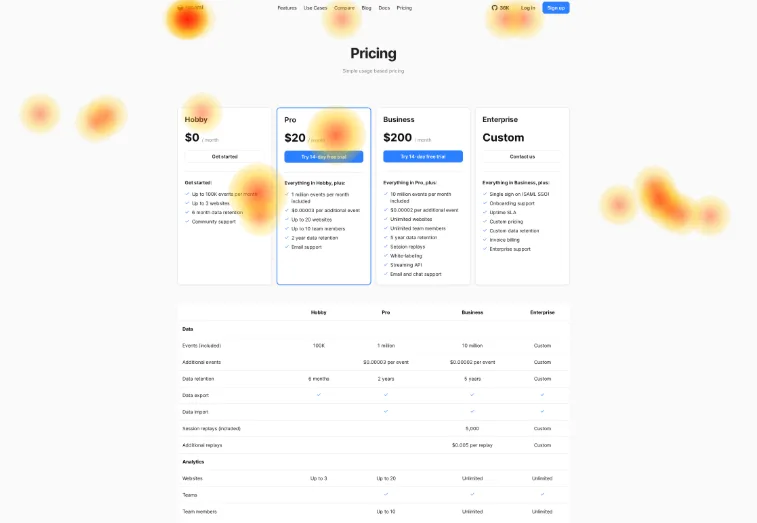
A few things click heatmaps are useful for:
- Confirming your buttons and links are being used: It's easy to assume things are working. Click heatmaps confirm it, or surface the cases where they aren't.
- Spotting clicks on things that aren't clickable: If visitors are clicking on something that isn't a link or button, that's a signal they expect something to happen. Worth paying attention to.
- Understanding whether your layout is directing attention correctly: Are visitors clicking where you want them to? Or is something else on the page pulling focus away?
Scroll Heatmaps
Scroll heatmaps show you how far down the page visitors are actually getting. The visualization fades as you move further down, giving you an immediate read on where most people stop.
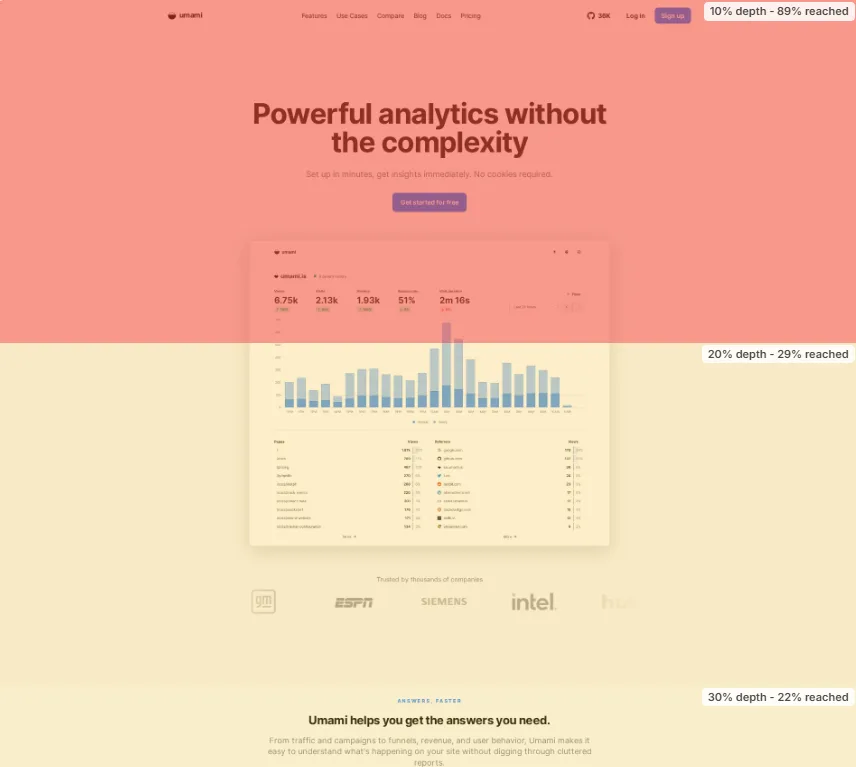
A few things scroll heatmaps help with:
- Understanding where visitors actually stop scrolling: This varies a lot depending on the device and screen size. Scroll heatmaps show you the real picture across your actual visitors.
- Knowing whether important content is getting seen: If your most important content sits below where most visitors stop, that's a real problem, one that's hard to spot from pageviews alone.
- Evaluating page length: Long pages aren't inherently bad, but scroll heatmaps help you see whether the length is working for you or against you.
Use cases
Product and Design Teams
If you're making decisions about page layout, heatmaps are a quick way to check your assumptions before committing to a redesign. Before you move a button or restructure a page, look at where users are actually clicking and how far they're scrolling. It's cheaper to test an idea with a heatmap than to ship something and find out later it made things worse.
Marketing Teams
Heatmaps are particularly useful for evaluating landing pages, especially after campaigns go live. If results are lower than expected, a scroll heatmap can tell you whether visitors are even making it to your offer. If they are, a click heatmap can tell you whether they're finding and clicking your sign-up or purchase button.
Content Teams
If you publish long-form content, scroll heatmaps help you understand how much of it people are actually reading. This can inform decisions about content structure, where to place important callouts, and how long your posts actually need to be.
Combining Heatmaps with Other Umami Reports
Heatmaps work best as one part of a broader picture. A few ways to use them alongside other Umami reports:
Heatmaps + Funnel Report: If you see visitors dropping off at a particular step, pull up the heatmap for that page to understand what they're actually doing there.
Heatmaps + Session Replays: Heatmaps show patterns across all visitors at once. Session replays show individual visits in detail. When a heatmap surfaces something unexpected, replays can help you understand the why behind it.
Heatmaps + Goals Report: Set a goal for a key action on a page, then use heatmaps to see whether your layout is supporting or working against it.
Getting Started
Heatmaps are available on the Business plan. Head to any page in your Umami dashboard and open the Heatmaps tab. For full details, check the docs.
If you have questions, reach out at [email protected] or find us on GitHub or Discord.