How to Analyze User Journeys on Your Website
Use page and event paths to find common routes, detours, exits, and unexpected paths to conversion, then turn those patterns into testable improvements.
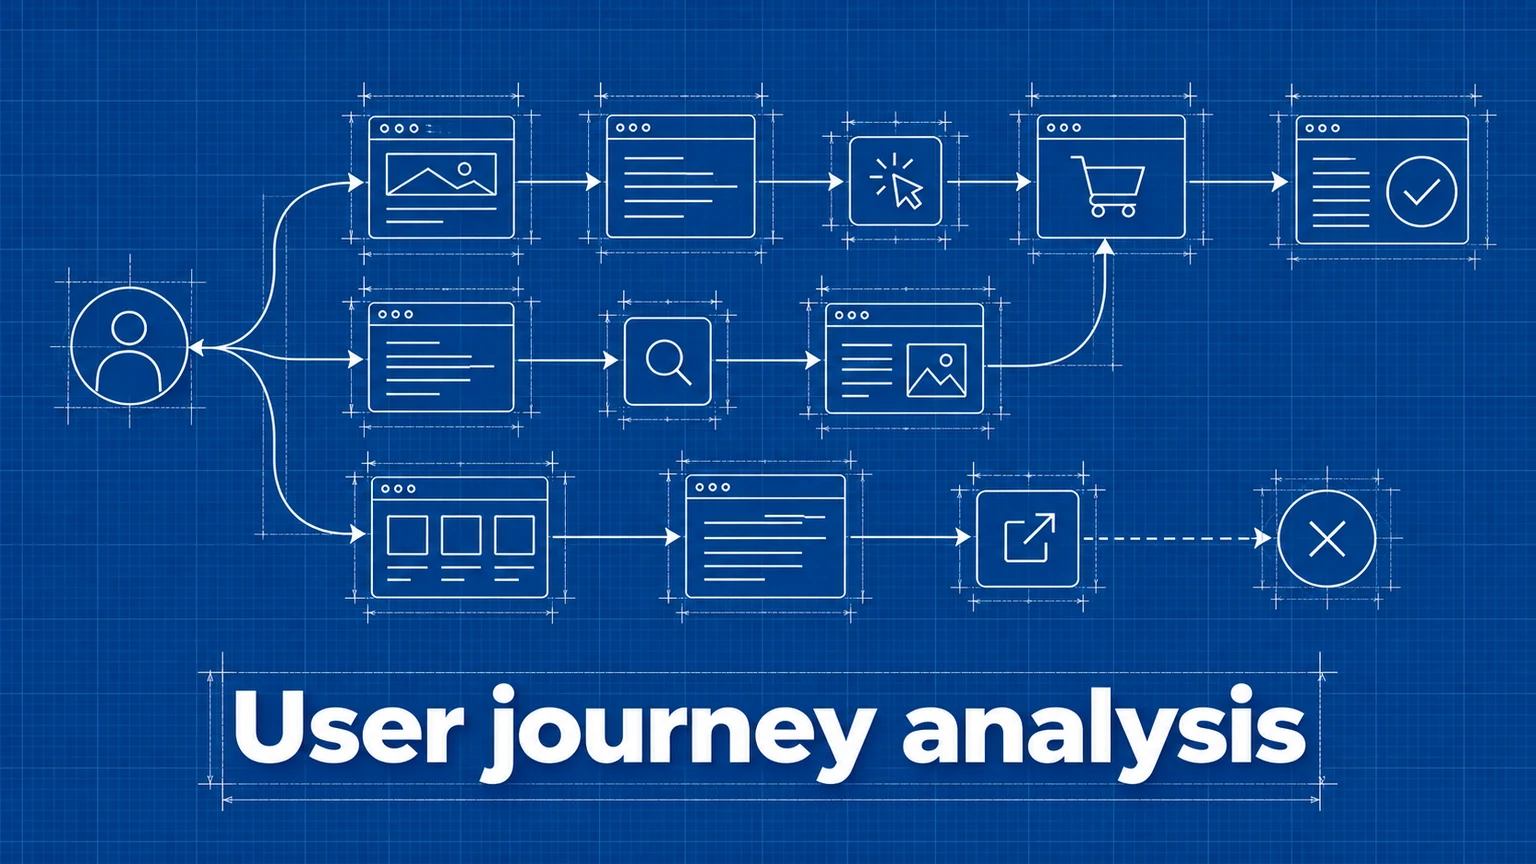
Visitors rarely follow the route drawn in a site's navigation plan. Some read a case study before pricing; others jump straight to signup, return to the homepage, or leave after a help page. Journey analysis shows these paths so you can investigate behavior that a single page's traffic total cannot explain.
This guide covers how to frame a journey question, explore paths in Umami, and decide what a surprising route means. For a predefined sequence with a conversion rate at each step, use conversion funnels.
Begin with a decision
Choose a question that could lead to a change. Examples:
- Where do visitors go after the pricing page?
- Which pages commonly precede a successful signup?
- Do visitors return to the same page before exiting?
- How do paths differ for campaign traffic and organic traffic?
Define the population before interpreting the picture. A journey that starts on the homepage answers a different question from one that starts on /pricing. Likewise, an end condition of signup-complete shows paths that reached that event; it does not describe everyone who considered signing up.
Make sure the actions that matter are recorded. Page views reveal navigation; custom events reveal steps such as opening a form or completing a purchase. Use a consistent event tracking plan so paths are readable.
Explore a journey in Umami
Umami's Journey insight displays common paths made from viewed pages and triggered events. Choose between three and seven steps, then optionally set a start step, an end step, or both. A step condition can be a page view or an event. Run the insight and select a node to follow the paths visitors took next. Hovering over a node shows conversion and drop-off information. The Journey documentation shows the current controls.
Start broad enough to discover paths, then narrow the view to answer a specific question:
- Choose a date range with enough activity to expose repeated routes.
- Start with three or four steps so the diagram remains readable.
- Set the entry page or event when you are investigating one part of the site.
- Follow the largest branches, then inspect smaller branches that lead to an important outcome.
- Change one condition at a time and compare the resulting paths.
Do not treat a path diagram as a map of every visitor. It reflects the selected window, step conditions, and recorded activity. Longer or cross-session behavior can extend beyond what the current view shows.
Read patterns as clues
Repeated pages or loops. A route like /pricing → /faq → /pricing may mean visitors are checking a detail before deciding. It could also be normal comparison behavior. Read the relevant pages and look for the unanswered question before changing the design.
Unexpected detours. If many visitors leave the intended route for documentation or support, the page they left may be missing essential context. Add that context where the decision happens, then measure whether the route and outcome change.
Exits after a specific step. A large branch ending after /checkout is worth investigating, but a journey alone does not tell you whether the cause is price, errors, shipping details, or a technical problem. Segment by device or source and complete the flow yourself.
Alternative routes to the same outcome. Visitors who sign up without viewing pricing are not necessarily anomalies. Their route may expose a more direct entry point worth preserving. Compare outcomes by route before forcing everyone through the assumed path.
The largest branch is not automatically the most valuable. A lower-volume path that ends in completed signups can matter more than a popular route that ends in exits.
Worked example: a signup detour
Imagine a software site whose expected route is homepage → pricing → signup. Its journey view shows a frequent detour: pricing → FAQ → pricing → signup. Another branch goes pricing → FAQ → exit.
The team checks the FAQ and finds that it explains a trial limitation the pricing page leaves unclear. Their hypothesis is that uncertainty sends visitors away to verify the limitation. They add a concise explanation beside the relevant plan, then compare the journey and signup-complete goal over a similar period. If traffic allows, an A/B test gives stronger evidence that the explanation caused a lift.
The important distinction is between observation and explanation: the route reveals where to investigate; it does not prove why visitors took it.
Use journeys with funnels and segments
A journey is good for discovery. Once you find a repeatable path worth monitoring, build a funnel with its key page and event milestones. The funnel then provides stable step counts and drop-off rates for that chosen sequence.
Segment the journey before making a site-wide change. Mobile visitors might loop between pricing and FAQ because a comparison table is hard to read; desktop visitors might not. Campaign visitors may land on a dedicated page and bypass the homepage entirely. Compare like audiences and similar date ranges, and check whether an apparent change is really a traffic mix shift.
Common mistakes
- Assuming the intended route is the only valid one. Visitors can convert through shorter or unexpected paths. Explore first, then decide which route needs help.
- Treating sequence as cause. Seeing an FAQ visit before exit does not prove the FAQ drove people away. Inspect the content and test a specific hypothesis.
- Reading tiny branches as trends. A path taken by a few visitors can change dramatically from day to day. Widen the date range before acting.
- Comparing unlike audiences. A route may appear to change because a campaign brought in different visitors. Segment by source and device before attributing it to a site edit.
- Using journeys as a conversion total. Step limits and conditions make a journey view narrower than a goal count. Use a goal or funnel when you need a defined denominator and repeatable conversion rate.
Frequently asked questions
What is the difference between a journey and a funnel?
A funnel measures progress through a sequence you chose in advance. A journey explores the paths visitors actually took through pages and events. Use a journey to discover routes and a funnel to measure a specific route consistently.
Does a common path mean it is the best path?
No. A path can be common because a page is prominent, confusing, or unavoidable. Compare paths with outcomes, inspect the pages involved, and test changes before calling one route better.
Why does my journey not show every visit?
The view is limited by the selected date range, step count, start and end conditions, and the activity your tracker recorded. Short visits, blocked tracking, and journeys outside the selected conditions may not appear in the path you are examining.
Umami is an open-source web and product analytics platform. Set up tracking in minutes and measure traffic, events, funnels, and retention without cookies.
Related documentation
Related guides

How to Build and Analyze a Conversion Funnel
How to design funnel steps, set time windows, interpret drop-off rates, and turn funnel data into changes worth testing.
Event Tracking Best Practices: Names, Properties, and Data Quality
Design useful website events, choose consistent names and properties, verify that they fire correctly, and keep your analytics free of sensitive data.

How to Analyze Changes in Website Traffic
A practical method for comparing traffic across time periods, separating real changes from seasonality and measurement artifacts, and finding what actually caused a spike or a drop.